Your KPIs erode quietly
between reports.
Fill rate slips, shrinkage drifts, GMROI drops, slowly, across hundreds of stores. Ward watches every metric, every store, every day and flags what’s off before it compounds.
The slow-bleed problems aggregate reports miss
A 2% fill rate decline at one store vanishes in a chain-wide average. Across 300 stores, those quiet declines add up fast. Ward baselines every metric at every location and surfaces deviations as insight cards, each with root cause and a recommended action. Thresholds are statistical: z-score against a 90-day rolling baseline, anomaly at p<0.01.
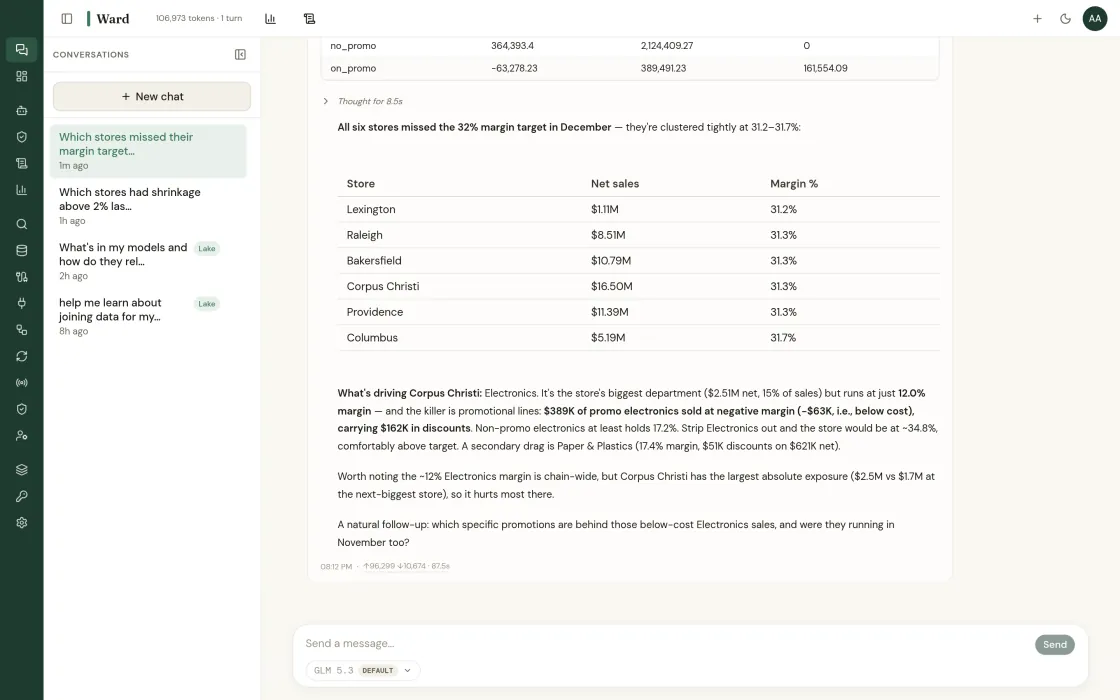
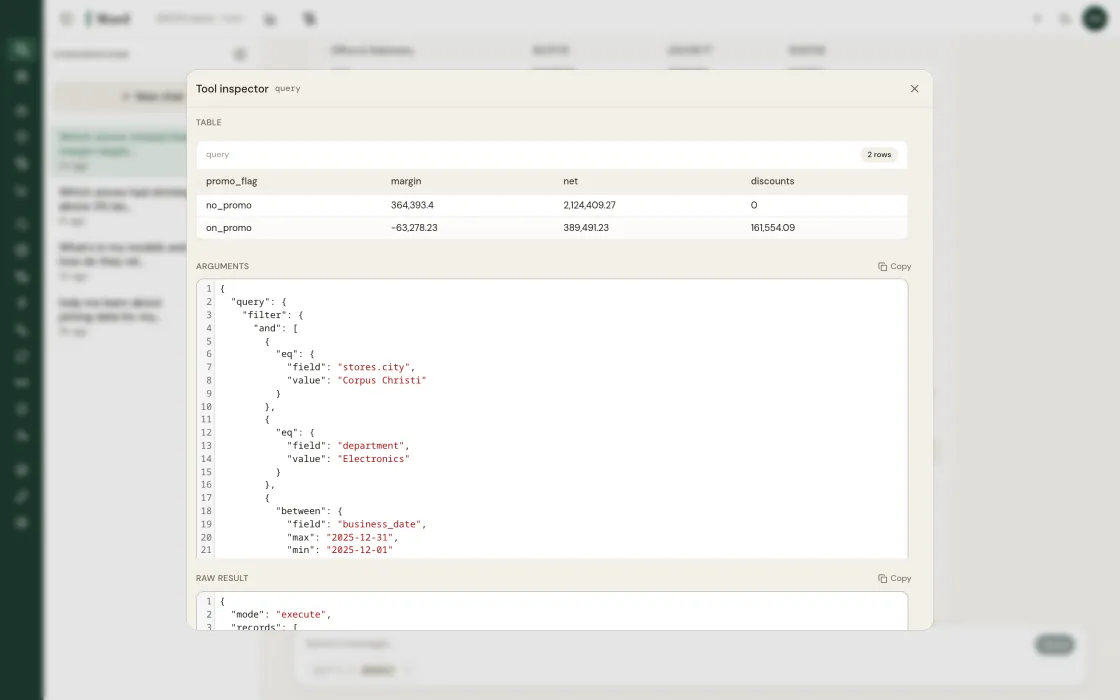
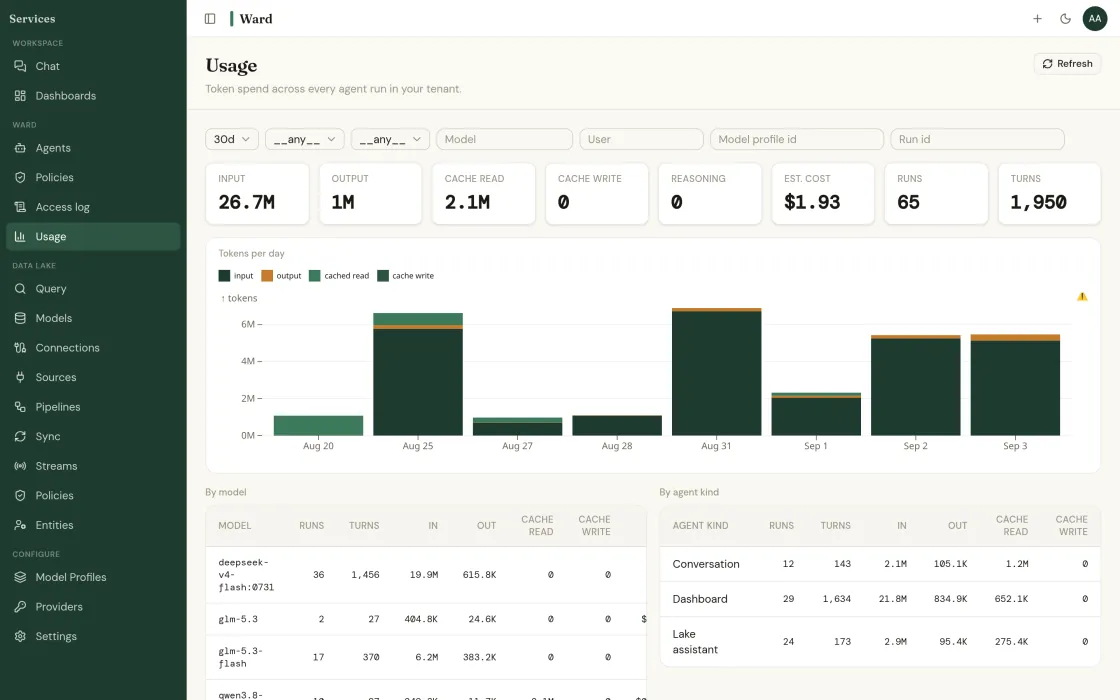
Five domains, continuous monitoring
Revenue, stores, finance, inventory, supply chain. Each domain has a dedicated agent tracking its KPIs around the clock and flagging deviations before they compound.
KPI glossary
Definitions, formulas, and benchmarks for every retail metric Ward tracks.
Where KPI Monitoring
does the work.
The insight types that lean on kpi monitoring to deliver value.
Built for the teams
that catch problems first.
The KPIs that change
when this runs.
Operator stories
and the alternatives.
Two ways to start.
Run a fixed-fee pilot on your data, or talk to advisory about a broader engagement.
Your KPIs erode quietly between reports.
Ward watches every metric, every store, every day. See what it finds.
御社のデータに何が隠れているか、確認する。
お客様のオペレーションについてお聞かせください。デモまたはPoCをご提案します。